PPP with NTRIP source for u-blox GNSS receiver over gpsd
This is now my fourth attempt to get an exact position (Precise Point Positioning) of my fixed mounted GNSS antenna at the roof of my house.
You can find the methods I used previously in my blogs here:
(1) PPP - Precise Point Positioning with averaging
(2) PPP with gpsrinex, CSRS-PPP and ECTT
(3) PPP with RTKlib and local correction
As GNSS receiver I used again my u-blox ZED-F9P
to manage this device I use the gpsd package.
The method is quite simple. Feed RTCM date as a NTRIP ( Networked Transport of RTCM via Internet Protocol ) stream to the GNSS receiver. To do so, one must use any NTRIP caster. There are several available for free and of course also some commercial. In any case you have to register as you need username and password.
As I am using the gpsd package I use the daemon gpsd itself to do this job.
This can be achieved by 2 different methods
- start gpsd with an additional argument like ntrip://my.user:my.passwd@157.90.249.44:2101/MOUNTPOINT
- run “gpsdctl add ntrip-URL”. This needs that gpsd was started with option “-F /run/gpsd.sock”
So what we need is username, password, the DNS name or IP address of the caster, the port number which is in almost all cases 2101 and the mountpoint. All mountpoints for a caster can be found at the caster itself and you should use one which is very close to you.
To be sure that my ZED-F9P is well configured I run some checks.
  ubxtool -g CFG-UART1INPROT-RTCM3X | grep CFG-UART1INPROT-RTCM3X

  echo check if skipped frames count up
  ubxtool -p MON-COMMS  | grep -A 7 UBX-MON-COMMS: | grep skipped
  sleep 10
  ubxtool -p MON-COMMS  | grep -A 7 UBX-MON-COMMS: | grep skipped

  ubxtool  -g CFG-NAVSPG-DYNMODEL | grep CFG-NAVSPG-DYNMODEL | head -1
  ubxtool  -z CFG-NAVSPG-DYNMODEL,2 | grep UBX-ACK-ACK:

  if test -z "`ubxtool -p NAV-PVT -v 2 | grep -i carrSoln | grep Fixed`"
    then
      echo state not fixed
      ubxtool -p NAV-PVT -v 2 | grep -i carrSoln
      exit 1
  fi

  echo number of satellites with cno greater 40
  ubxtool -p NAV-SIG -v 2 | grep cno | awk '{ if ( $12 > 40 ) print ( $2, $4 ) }' | sort -u | wc -l

  echo accuracy in 0.1 mm
  ubxtool -p NAV-RELPOSNED -v 2 | grep -i accN

  ubxtool -z CFG-MSGOUT-UBX_RXM_RTCM_UART1,1 | grep UBX-ACK-ACK:

  RESULT=`ubxtool -v 2 -w 10 | grep -i RTCM`

  if test -z "$RESULT"
    then
      echo we dont get RTCM data
      exit 1
  fi

  ubxtool -z CFG-NMEA-HIGHPREC,1  | grep UBX-ACK-ACK: # ist default 0
  ubxtool -z CFG-MSGOUT-NMEA_ID_GGA_UART1,1 | grep UBX-ACK-ACK:

  # for standard deviation
  ubxtool -z CFG-MSGOUT-NMEA_ID_GST_UART1,1 | grep UBX-ACK-ACK:
I start gpspipe
nohup socat EXEC:'gpspipe -rRB gpsdhost\:2947\:/dev/serial0' 'TCP-LISTEN:10001,reuseaddr,fork' &
and I collect the data with
SEC=3600
DAT=`date '+%j%H%M00'`
timeout $SEC nc 127.0.0.1 10001 | grep --line-buffered -aE "GGA|GST" > $MP/messung_$DAT.nmea
$SEC is the time in seconds how long I want to collect the data. One hour is normally good enough. $MP is the mountpoint selected in the ntrip-URL. If all is fine I extract the position data from the file with this script
nmea2pos.bash $MP/messung_$DAT
This will create a file $MP/messung_$DAT.pos which can be viewed with rtkplot-qt.
I run this scenario over several times. And this is the result
| date | latitude | longitude | altitude |
|---|---|---|---|
| messung_049220424 | 48.14928668858 | 16.28383489981 | 286.34149647059 |
| messung_049220558 | 48.14928651058 | 16.28383491739 | 286.34408541973 |
| messung_049224529 | 48.14928646948 | 16.28383476017 | 286.32093080357 |
| messung_051190411 | 48.14928674470 | 16.28383504772 | 286.35412230216 |
| messung_053164800 | 48.14928685024 | 16.28383472580 | 286.29313600000 |
| messung_053164900 | 48.14928721850 | 16.28383476294 | 286.34042372881 |
| messung_053170600 | 48.14928712056 | 16.28383469769 | 286.35376422764 |
| messung_053171700 | 48.14928646645 | 16.28383503276 | 286.33033740831 |
| messung_053182000 | 48.14928761124 | 16.28383548462 | 286.31665768194 |
| messung_053184700 | 48.14928675778 | 16.28383470345 | 286.25878328474 |
| messung_056172800 | 48.14928653393 | 16.28383432340 | 286.44596396396 |
| messung_056173000 | 48.14928641814 | 16.28383453253 | 286.46528272251 |
| messung_056174600 | 48.14928641787 | 16.28383439221 | 286.44075187970 |
| messung_056174700 | 48.14928635164 | 16.28383422094 | 286.38687192983 |
| messung_056203500 | 48.14928663041 | 16.28383471765 | 286.38973867596 |
| messung_057102300 | 48.14928749432 | 16.28383523683 | 286.41764218009 |
| messung_057113100 | 48.14928616931 | 16.28383569321 | 286.21828049137 |
| messung_057172000 | 48.14928643937 | 16.28383441440 | 286.37522851677 |
| messung_064192300 | 48.14928611437 | 16.28383541068 | 286.39431147541 |
| messung_064193000 | 48.14928626123 | 16.28383493320 | 286.45333041958 |
| messung_065185800 | 48.14928580792 | 16.28383442479 | 286.43519302326 |
| average | 48.14928662270 | 16.28383482534 | 286.36553964790 |
4092523.5748    1195484.3667    4728180.7527
48.14928662270  16.28383482534  286.3655
48 8 57.43184   16 17 1.80537
The maximum distance to the average point is 13.5 cm. The maximum distance between 2 measuring points is 21.5 cm.
Takeing the average value and calculating the distance to method (2) we get an offset of 6.8 cm. Distance to method (3) is 3.9 cm.
Below the is a plot of one of these traces done with rtkplot_qt
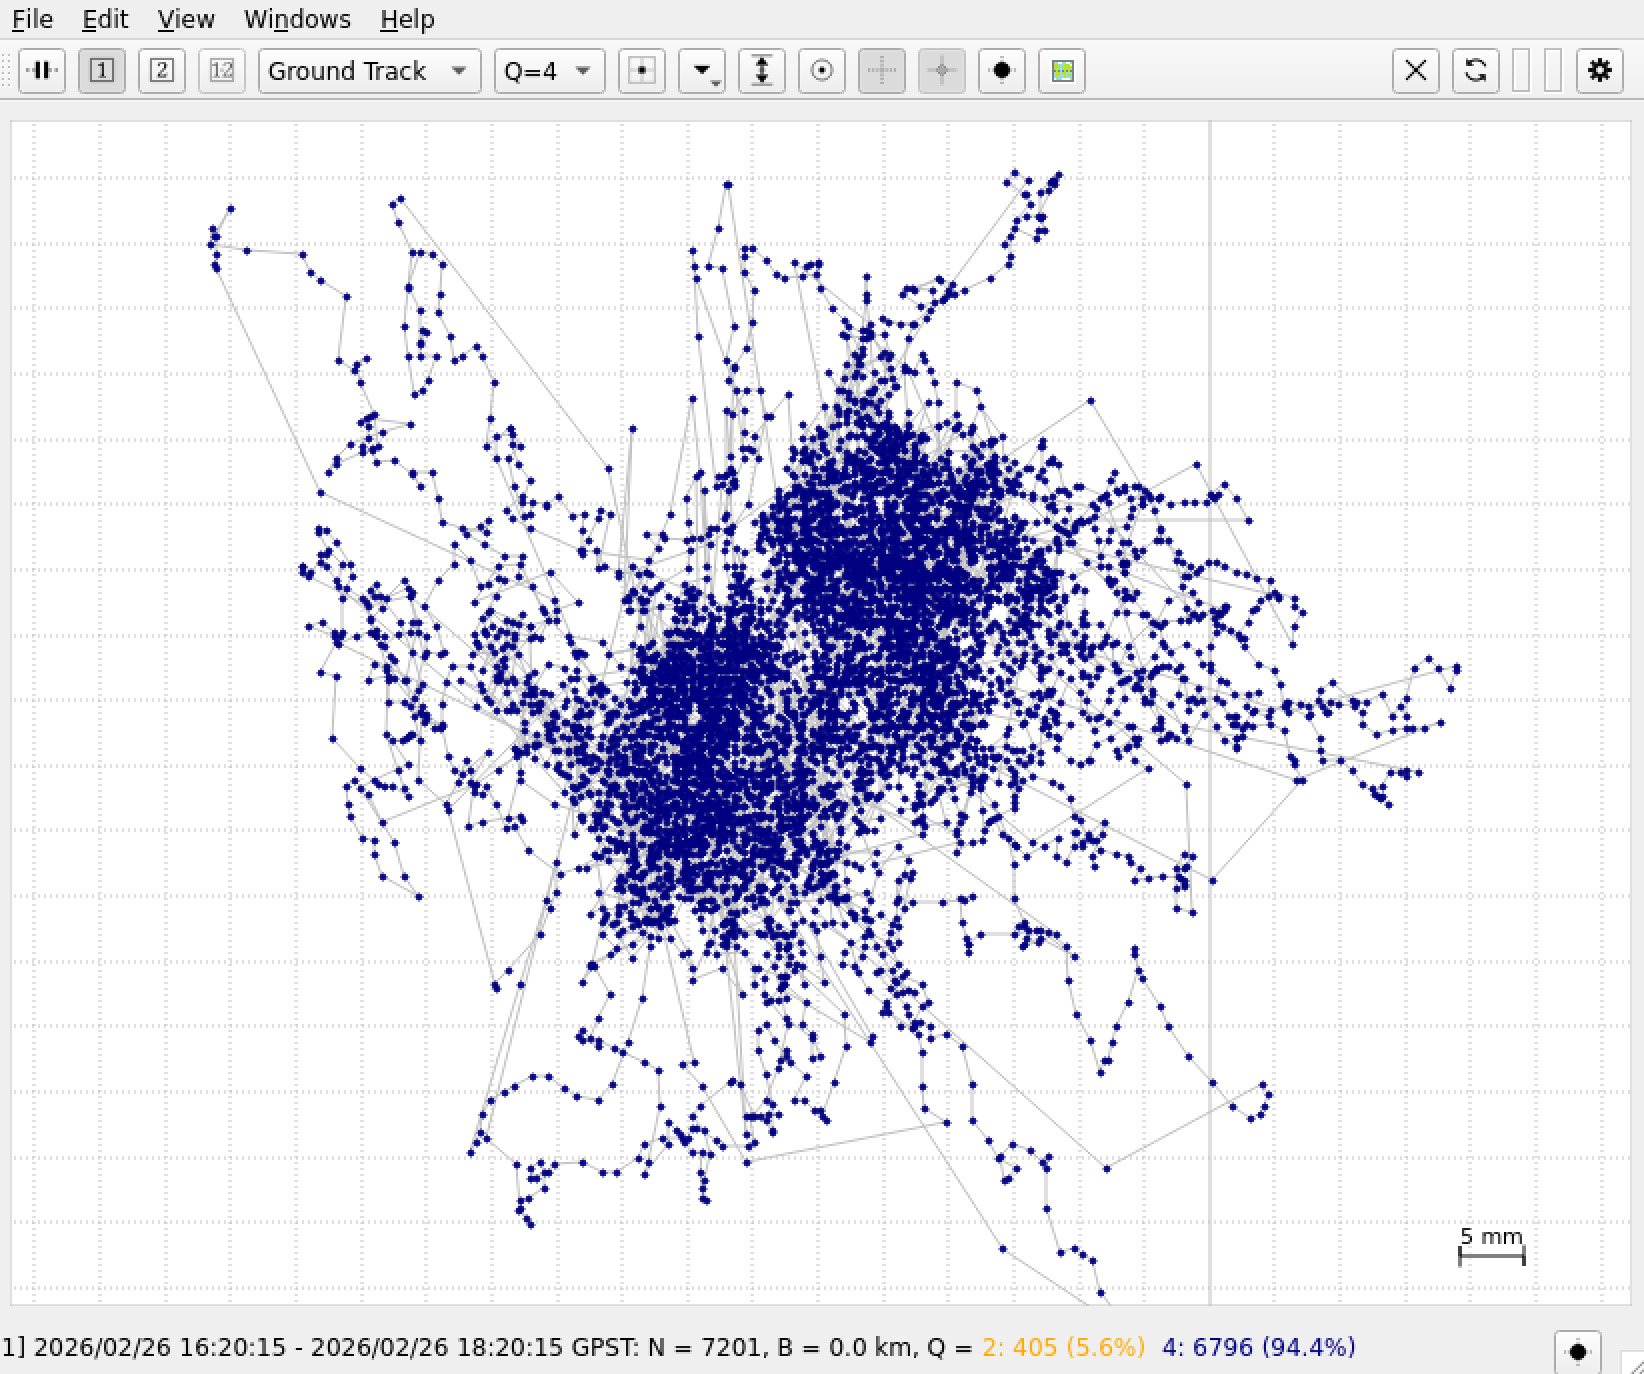
As we can see there are 71.4% of all points with Q = 1 that is status “FIX”. I took only those point for the calculation of the average value. The area is about 5 times 6 cm.
Tools at github:
A commandline tool to transform ecef wgs84 data.
A commandline tool which converts NMEA to high-precision .pos position logs data.