PPP - Precise Point Positioning with averaging
I was fascinated about this article https://gpsd.gitlab.io/gpsd/ppp-howto.html
Therefore I tried it.
I own a ZED-F9P from U-blox with a fix mounted antenna on the top of the roof of my house.
I was interested in the method of averaging.
The steps for a 24 hour average result are quite easy, assuming one has “gpsd” and all these tools installed.
gpsprof -n 86400  -T pngcairo   localhost:gpsd:/dev/serial0 > $FILENAME.plot
gnuplot < $FILENAME.plot > $FILENAME.png
display $FILENAME.png &
I used the standard configuration. That means I used all 6 satellites I can receive: GPS, SBAS, Galileo, BeiDou, QZSS and GLONASS. And I used “dynModel 0”. ( 0 = portable )
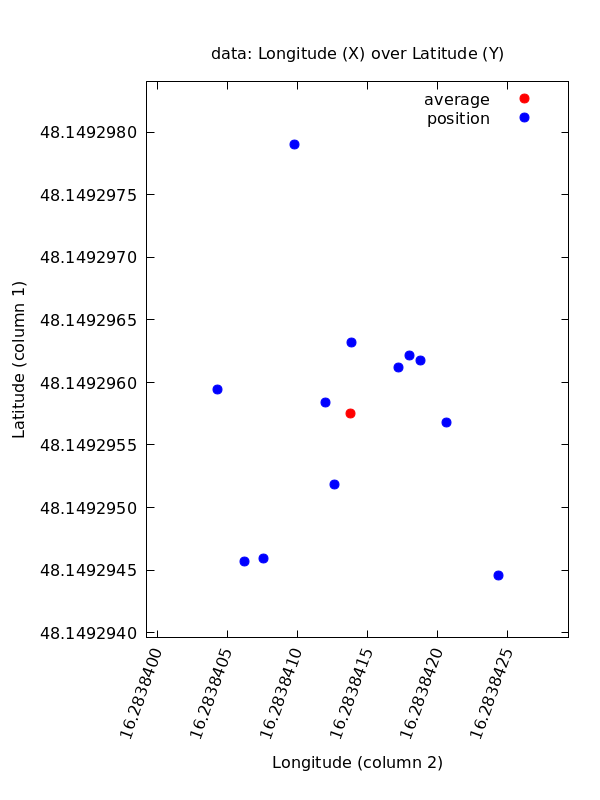
I have done this for 6 days each 24 hours and got the following result:
| day config1 | lat | lon | AltHAE | CEP50 | CEP99 | EP50 | EP99 |
|---|---|---|---|---|---|---|---|
| sc_f9p_1d_0501_cfg01.plot | 48.149295188 | 16.283841264 | 287.224 | 0.560 | 2.014 | 0.738 | 3.048 |
| sc_f9p_1d_0502_cfg01.plot | 48.149294591 | 16.283840758 | 287.417 | 0.736 | 1.784 | 0.721 | 2.980 |
| sc_f9p_1d_0503_cfg01.plot | 48.149294566 | 16.283840620 | 287.354 | 0.704 | 1.326 | 0.759 | 2.875 |
| sc_f9p_1d_0504_cfg01.plot | 48.149296214 | 16.283841799 | 287.095 | 0.588 | 1.513 | 0.752 | 2.919 |
| sc_f9p_1d_0505_cfg01.plot | 48.149295680 | 16.283842060 | 287.137 | 0.551 | 1.733 | 0.699 | 2.764 |
| sc_f9p_1d_0506_cfg01.plot | 48.149297905 | 16.283840979 | 287.696 | 0.607 | 1.603 | 0.723 | 2.985 |
| average | 48.149295690 | 16.283841246 | 287.321 | 0.624 | 1.662 | 0.732 | 2.928 |
| deviation | 1.14776e-06 | 5.27579e-07 | 0.202184 | 0.07065 | 0.2169 | 0.0202 | 0.09141 |
I calculated the distance between any of these results and it was not bigger than 37.2 cm.
One can say that all results are within a circle of about 20 cm radius.
The next test was to use “dynModel 2”. ( 2 = stationary )
| day config4 | lat | lon | AltHAE | CEP50 | CEP99 | EP50 | EP99 |
|---|---|---|---|---|---|---|---|
| sc_f9p_1d_0508_cfg04.plot | 48.149296323 | 16.283841385 | 286.960 | 0.740 | 1.987 | 0.829 | 3.173 |
| sc_f9p_1d_0509_cfg04.plot | 48.149295842 | 16.283841204 | 286.905 | 0.640 | 1.563 | 0.723 | 2.891 |
| sc_f9p_1d_0510_cfg04.plot | 48.149295943 | 16.283840428 | 287.110 | 0.753 | 1.381 | 0.762 | 3.282 |
| sc_f9p_1d_0511_cfg04.plot | 48.149294459 | 16.283842436 | 287.532 | 0.829 | 1.514 | 0.853 | 3.137 |
| sc_f9p_1d_0512_cfg04.plot | 48.149296177 | 16.283841876 | 287.672 | 0.832 | 2.139 | 0.801 | 3.160 |
| sc_f9p_1d_0513_cfg04.plot | 48.149296121 | 16.283841722 | 287.537 | 0.805 | 2.082 | 0.781 | 3.319 |
| average | 48.149295810 | 16.283841508 | 287.286 | 0.767 | 1.778 | 0.792 | 3.160 |
| deviation | 6.24298e-07 | 6.21336e-07 | 0.304118 | 0.06654 | 0.29998 | 0.04272 | 0.13737 |
I expected better results. But this wasn’t the case.
The maximum distance between these results was 22.2 cm. Between all 12 measurements it is 40 cm. But the distance for these averaged values for config1 and config4 is only 2.4 cm.