EFRATOM LPRO-101 adjusting
This document describes how-to adjust an EFRATOM LPRO-101 using a NTP daemon
I bought a refurbished EFRATOM LPRO-101 from the second hand market. It’s coming from China and I paid about 80 EUR in October 2010. Some weeks ago you could buy it for less than 80 USD. As this LPRO is a secondary frequency standard you cannot expect an accuracy of theoretical 3 * 10 ^ -15 for rubidium
The one I bought had an offset less than 0.1 HZ at 10 MHz which is about 10 ^ -8
In most cases this is good enough for private use. Not so if you are ham operator and playing around with micro wave equipment or if you try to use this frequency standard as stratum 0 source for a NTP server. As you can easy calculate this clock would go wrong about 3 seconds per year. This is not much better than a quartz watch.
Adjusting the frequency of the LPRO-101 is easy as it has a potentiometer for the C-field. It is easy if you have a second 10 MHz reference which is much more precisely. I don’t have one so I took the approach to look for the drift over long time period. I compare the EFRATOM with a GPS 1PPS signal. To do so I feed both signals to the GPIO chip of a Banana Pi. ( To use a second 1PPS you have to compile a second PPS GPIO module see https://github.com/hans-mayer/pps2gpio and to compile a module you have to compiler the kernel first Banana Pi compile kernel and header ) On this system I run “ntpd” with two PPS references:
server 127.127.22.0 minpoll 5 maxpoll 6
server 127.127.22.1 minpoll 5 maxpoll 6 noselect
And a lot of other configuration directives. Running “ntpq -pn” one can see:
     remote       refid      st t when poll reach   delay   offset  jitter
==========================================================================
o127.127.22.0    .PPS.        0 l    7   64  377    0.000   -0.005   0.003
*127.127.28.0    .GPS.        0 l    9   32  377    0.000   -0.674   0.682
 127.127.22.1    .PPS2.       0 l   28   32  377    0.000  294.516   0.005
I wrote a small shell/gawk/gnu-plot script called ntp_shdiff ( see https://github.com/hans-mayer/ntpgraph ) to plot the difference of two NTP server. Running this after several hours I could see
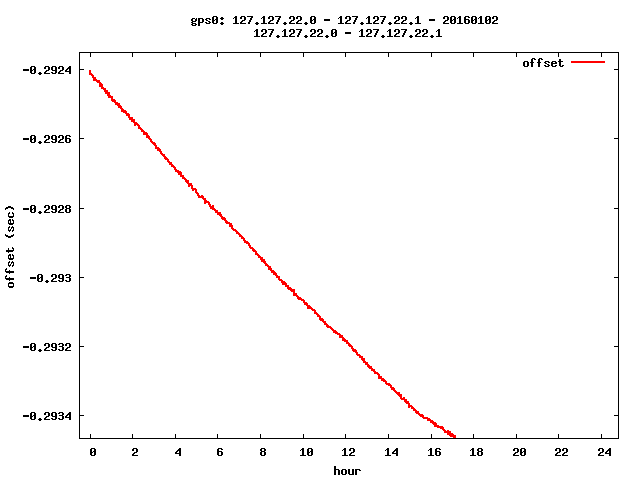
Sun Jan 3 00:13:20 CET 2016 I took 2 measure points and did the calculation:
mp1 : x=0.0173913 y=-0.292421
mp2 : x=16.8261 y=-0.293467  ( x = time decimal hours )

drift .00000001728601290803 per second
1.7 ^-2 = 17 ^-3  ppm  = 1.7 ^-8
So I produced a screw driver ( those one I have owned were to short ) and turned the potentiometer clockwise for 90 degrees. Actually not knowing in which direction I should turn. But I had luck. Next day a measurement:
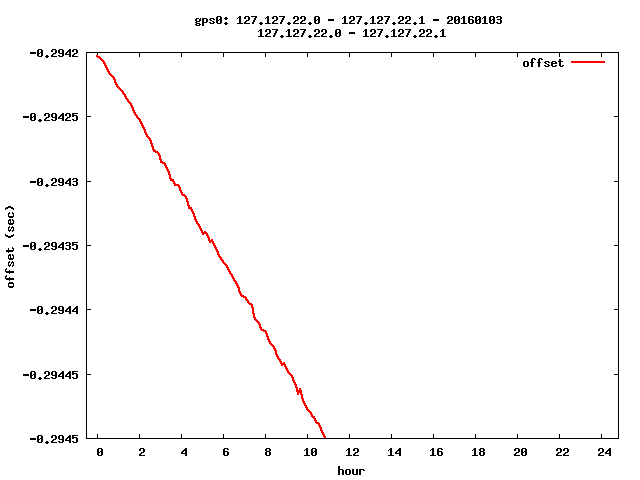
mp1: x=0.368613 y=-0.29471
mp2: x=9.24453 y=-0.29495

drift .00000000751096102708 per second
7.5 ^-3 ppm = 7.5 ^-9
Sun Jan 3 10:23:35 CET 2016 I turned again the potentiometer clockwise for 90 degrees.
Let’s see.
Mon Jan 4 21:58:38 CET 2016
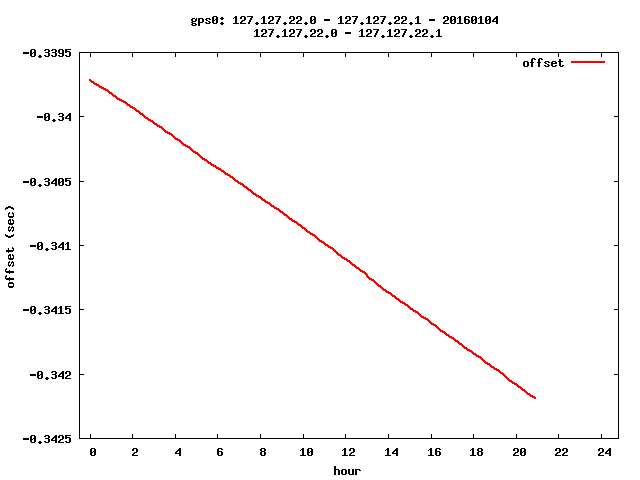
Surprise surprise.
Instead of a smaller drift it’s much bigger.
mp1: x=79.012 y=-0.339719843
mp2: x=74703.012 y=-0.342186132 ( x = time in seconds )

drift .00000003304954170240 per second
So I will turn the potentiometer counter clockwise 360 degrees.
Tuesday, January 5, 2016 04:59:05 PM CET - no change
47.012 0.342543585
57263.013 0.344436830

drift .00000003308943244740 per second
Sun Jan 10 20:46:57 CET 2016
After some days of observation I can say:
turning the potentiometer counter clockwise reduce the frequency
turning the potentiometer clockwise increase the frequency
For easier verification I modified my scripts for viewing NTP statistic files. Now it is possible to generate a FIT function. The text output prints directly the value. Running
ntp_shdiff -t 30 -F 1 -x -0.5:21.1 -f png 127.127.22.1 127.127.22.0 0110
I can see the graph
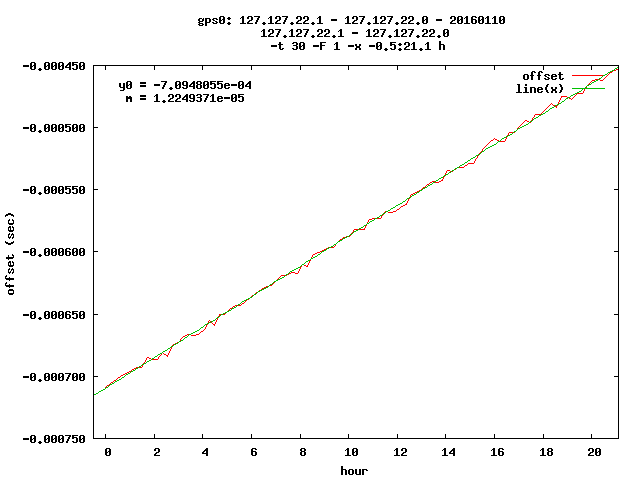
and reading the result on the text screen
m = 1.224937106662e-05 which is now the drift in hours, but easy to calculate drift per second: .00000000340260307406 or ppb: 3.40260307406
What I have done additionally I made the rubidium source ( 127.127.22.1 ) as primary time source and the GPS source ( 127.127.22.0 ) only as reference. This is because GPS has a jitter and makes adjustments not easy. As side effect if I change the rubidium frequency it seems the drift of the GPS will change.
Sun Feb 21 21:00:41 CET 2016
I recognized it is not possible to adjust the frequency exactly to 10 MHz with the internal trimmer.
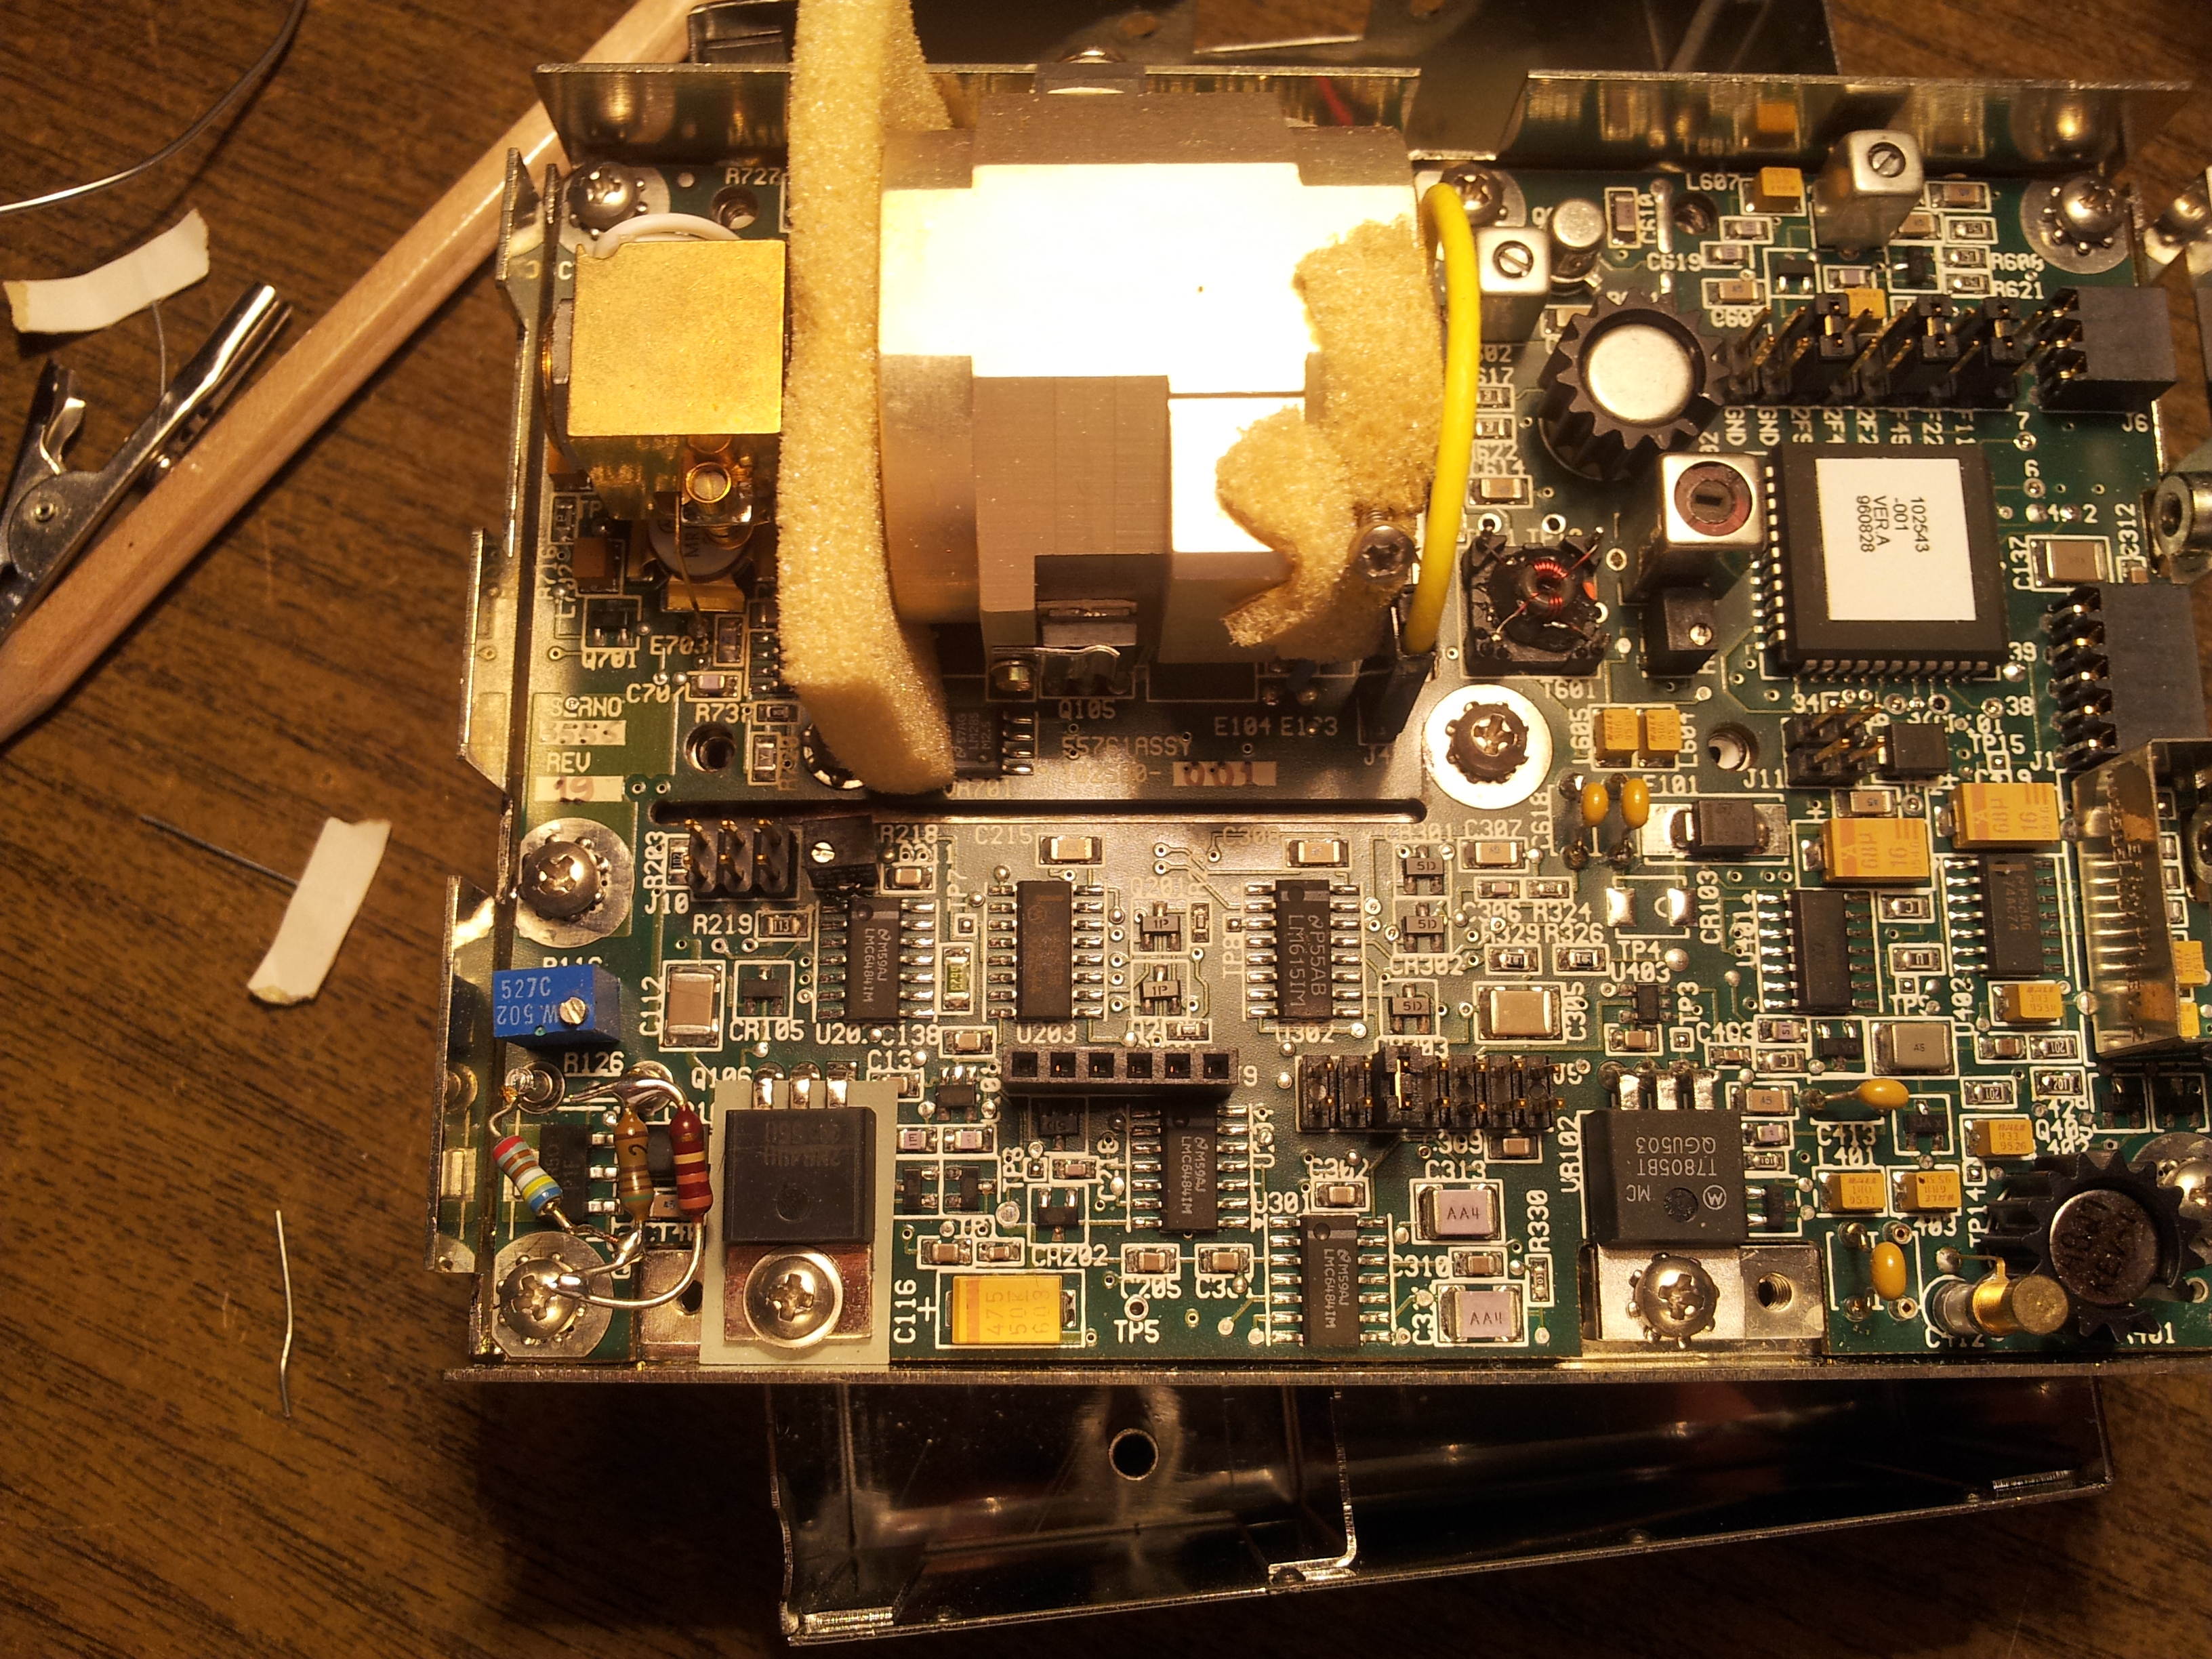
I opened the case.
R126 has a value of 6.51 kohm I add a resistor in series of 1.007 k
Wed Feb 24 22:19:48 CET 2016
The difference of the frequency didn’t change dramatically. 127.127.22.0 is again time source.
ntp_shdiff -t 30 -F 1 -x -0.5:19.5 -f png 127.127.22.1 127.127.22.0 0224
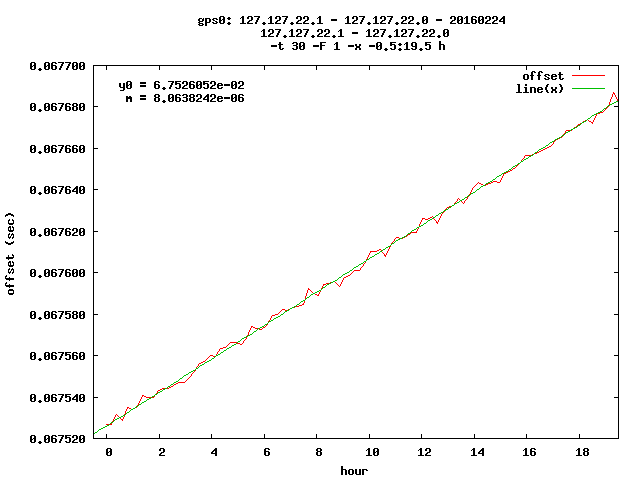
m = 8.06382423182752e-06 which is 2.239951175 ppb
The difference against the situation without the resistor is 1.162 ppb
The lamp voltage on PIN 5 is 6.86 V
Sun Feb 28 20:27:39 CET 2016
Yesterday I removed the 1k resistor and replaced by a 5k1 resistor. The situation is much better.
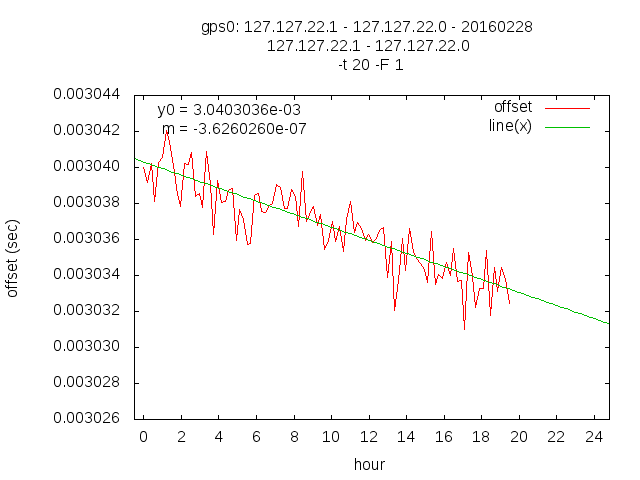
m = -3.63573255384452e-07 which is -0.10072 ppb
With the previous results we get the following table: ( R in kilo-ohm )
| PPB | R | |
|---|---|---|
| +3.40 | 0.0 | |
| +2.24 | 1.0 | |
| -0.10 | 5.1 | |
Doing the math: looking for a second-degree polynomial for interpolation
f(x) = y0 + mx + nx^2 = 4.8678219 + -2.2963496 * x + 0.2543050 * X^2
export X=0 ; dc <<< "20k 4.8678219 _2.2963496 $X *+ 0.2543050 $X d **+ p"
we get the result: 4.868 kohm
I will connect a parallel resistor with 110 k - actually it has 113k6
Mon Feb 29 20:53:27 CET 2016
The happy end
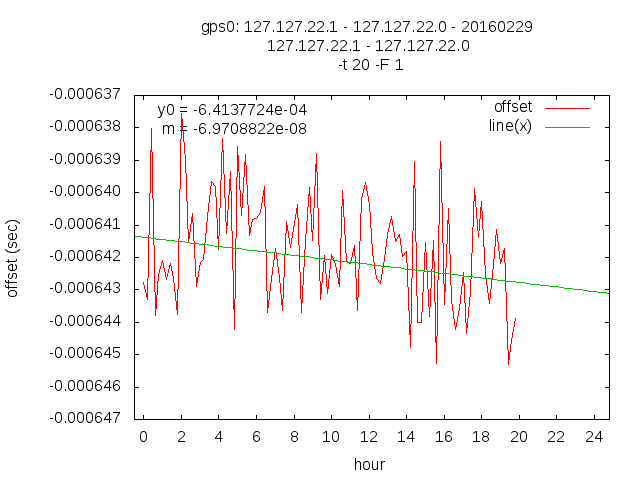
drift per second: _.00000000001936356165 ppb: -.01936356165000000000
drift per hour: -.00000006970882194488
drift per day: _.00000167301172667712
drift per month: _.00005088744001976240
drift per year: -.00061064928023714880
| PPB | R | |
|---|---|---|
| +3.40 | 0.0 | |
| +2.24 | 1.0 | |
| -0.02 | 4.88 | |
| -0.10 | 5.1 | |
The lamp voltage on PIN 5 is 6.87 V measured with a cheap voltmeter.
ppb: -0.01909162956
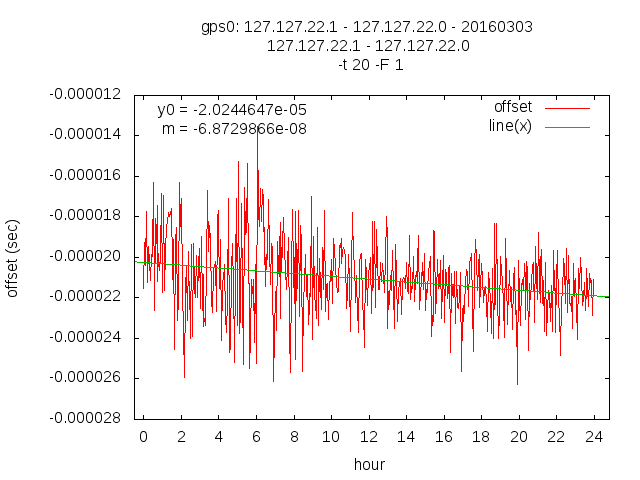
I turned the internal trimmer 4 times clockwise. The next days plot shows the change.
Fri Mar 4 22:22:22 CET 2016
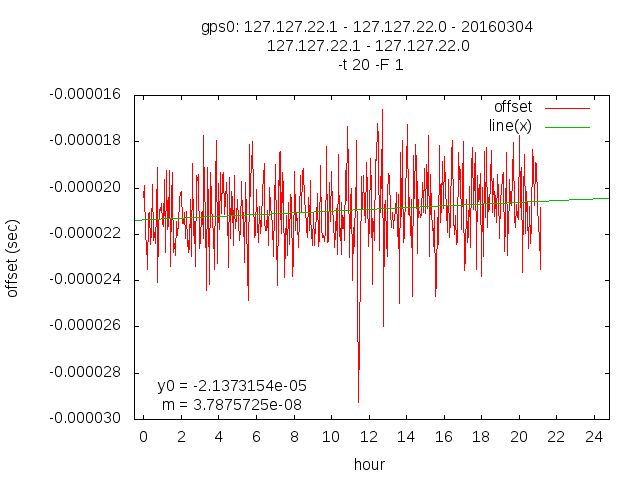
ppb: +0.01052103476
Thu Mar 10 21:56:11 CET 2016
The result after turning the trimmer 2x 1/3 turns ( = 2/3 ) to the left ( counter clockwise )
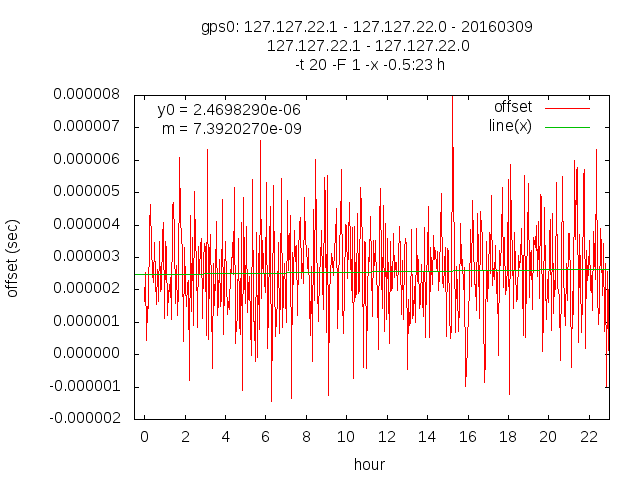
drift per second: .00000000000205334083 ppb: .00205334083000000000
drift per hour: .00000000739202701370
drift per day: .00000017740864832880
drift per month: .00000539617972000100
drift per year: .00006475415664001200
Fri Mar 11 20:09:16 CET 2016
The next day wihtout any changes.
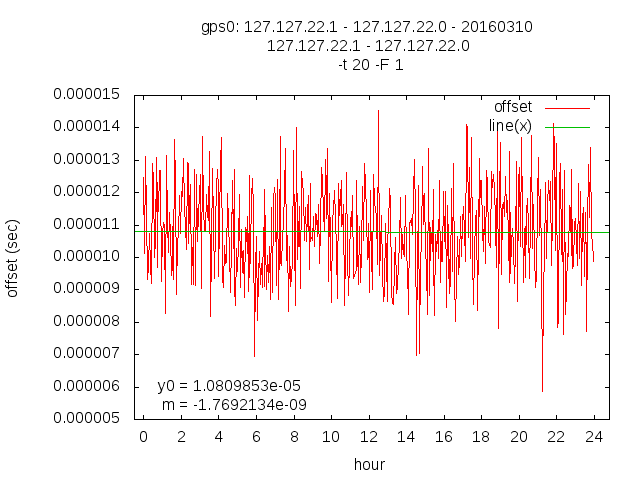
drift per second: _.00000000000049144816 ppb: -.00049144816000000000
drift per hour: -.00000000176921340005
drift per day: _.00000004246112160120
drift per month: _.00000129152578203650
drift per year: -.00001549830938443800