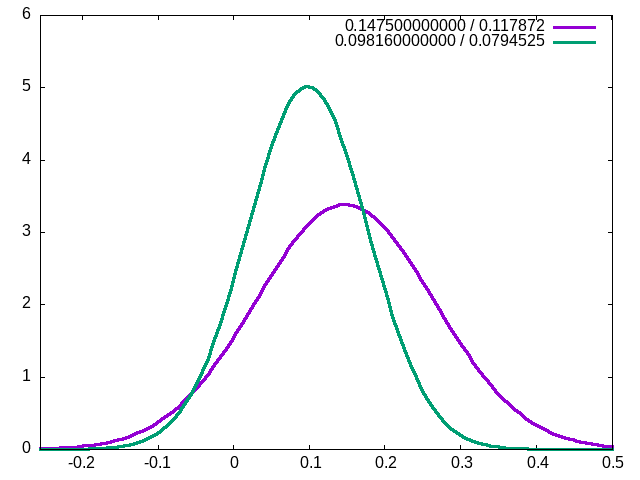
plot2gaussian
A simple bash script with gnuplot to draw 2 gaussian curves
plot2gaussian_ksh 0.147500000000 0.117872 0.098160000000 0.0794525

plot2gaussian_ksh
#!/usr/bin/bash

# program to plot 2 gaussian graphs

# dieses programm zeichnet mittels gnuplot 2 graphen normalverteilter funktionen
# gegeben mit mittelwert und standardabweichung

# Fri 12 May 2023 08:57:13 PM CEST - mayer

# https://lwn.net/Articles/628537/
# https://de.wikipedia.org/wiki/Normalverteilung


export MEAN1 DEVI1 MEAN2 DEVI2 RANGEL RANGEH DEVAMX MULT

# if 6 parameters are given z-test will be executed with thenumber of probes
# in this case this program doesn't use parameter 3 and 6

# environment variables from outside
# MYPLOTTERM if set for example with "png" output will be written to a .png file in /tmp
# otherwise an existing X11 environment must exist do show result on screen
# MULT default value is 3.0 - it can be used to enlarge or reduce the plot area


case $# in
  4 )
	MEAN1=$1
	DEVI1=$2
	MEAN2=$3
	DEVI2=$4
	;;
  6 )
	MEAN1=$1
	DEVI1=$2
	NUM1=$3
	MEAN2=$4
	DEVI2=$5
	NUM2=$6
	;;
  * )
	echo "usage: $0 MEAN1 DEVI1 MEAN2 DEVI2 "
        exit 1
	;;
esac

# in DEVMAX is the bigger number of both deviations
DEVMAX=`echo $DEVI1 $DEVI2 | awk '{ if ( $1 > $2 ) print ( $1 ) ; else print ( $2) }' `

if test -z "$MYPLOTTERM"
  then
    MYPLOTTERM="x11 persist"
  else
    echo $MYPLOTTERM
    OUTPUT="set output \"/tmp/plot_gauss.$MYPLOTTERM\" "
fi

if test -z "$MULT"
  then
    MULT=3.0
  else
    echo MULT: $MULT
fi

# calcualte the area we want to plot
RANGEL=`echo $MEAN1 $MEAN2 $DEVMAX | \
	awk -v MULT=$MULT '{ if ( $1 < $2 ) print ( $1 - MULT * $3  ) ; else print ( $2 - MULT * $3  ) }' `
RANGEH=`echo $MEAN1 $MEAN2 $DEVMAX | \
	awk -v MULT=$MULT '{ if ( $2 > $1 ) print ( $2 + MULT * $3  ) ; else print ( $1 + MULT * $3  ) }' `

: echo RANGEL $RANGEL RANGEH $RANGEH

echo "
  set term $MYPLOTTERM
  $OUTPUT
  set samp 100
  set xrange [$RANGEL:$RANGEH]
  # plot for [s=1:2] exp(-x**2/(2*s**2))/(s*sqrt(2*pi)) lw 3
  s1 = $DEVI1
  s2 = $DEVI2
  plot exp(-(x-$MEAN1)**2/(2*s1**2))/(s1*sqrt(2*pi)) title \"$MEAN1 / $DEVI1\" lw 3 , \
	exp(-(x-$MEAN2)**2/(2*s2**2))/(s2*sqrt(2*pi)) title \"$MEAN2 / $DEVI2\" lw 3
" | gnuplot

if test $# -eq 6
  then
    ztest_ksh $MEAN1 $DEVI1 $NUM1 $MEAN2 $DEVI2 $NUM2
fi